
About
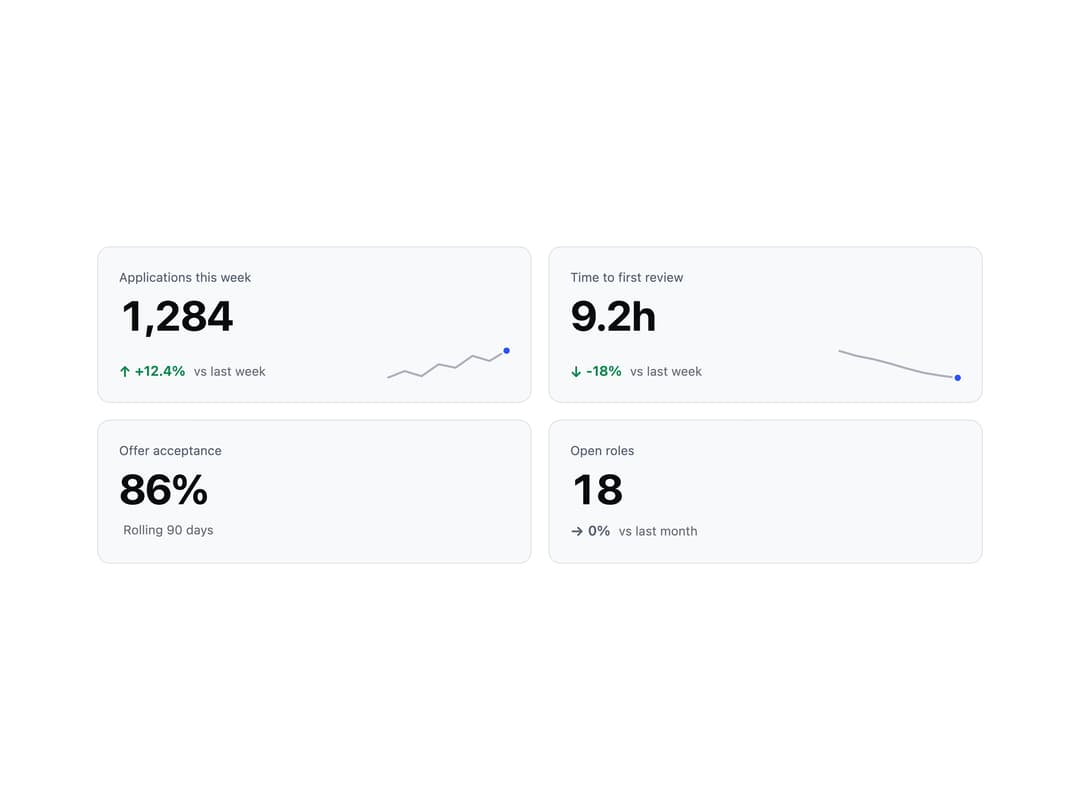
A compact metric card that shows one key number together with its label, a signed percentage change with a direction arrow, a comparison period, and an optional inline sparkline trend.
Built with React and Tailwind. Copy the prompt and paste it into Claude Code, Cursor or Lovable: your agent adds Stat to your project and fits it to your theme.
Code
How Stat is used: the demo's code. The component's own source comes with a free account.
Usage.tsx
import Stat from "@/components/ui/stat";

export default function StatDemo() {
  return (
    <div className="grid w-full max-w-4xl grid-cols-1 gap-4 p-6 sm:grid-cols-2">
      <Stat
        label="Applications this week"
        value="1,284"
        delta={12.4}
        period="vs last week"
        trend={[18, 22, 19, 26, 24, 31, 28, 34]}
      />
      <Stat
        label="Time to first review"
        value="9.2h"
        delta={-18}
        upIsGood={false}
        period="vs last week"
        trend={[14.1, 13.2, 12.6, 11.8, 10.9, 10.1, 9.6, 9.2]}
      />
      <Stat label="Offer acceptance" value="86%" period="Rolling 90 days" />
      <Stat label="Open roles" value="18" delta={0} period="vs last month" />
    </div>
  );
}
More by redrob-labs
View all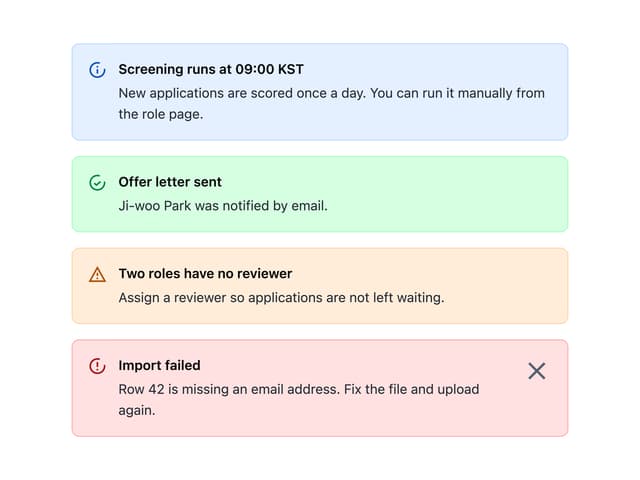
Alert
18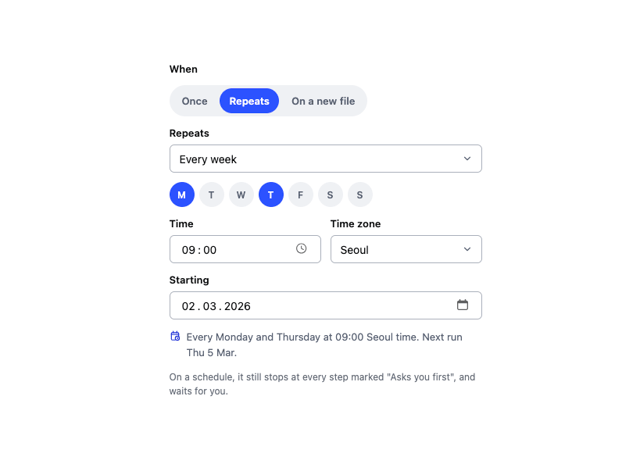
Schedule Picker
15
Hero Section
7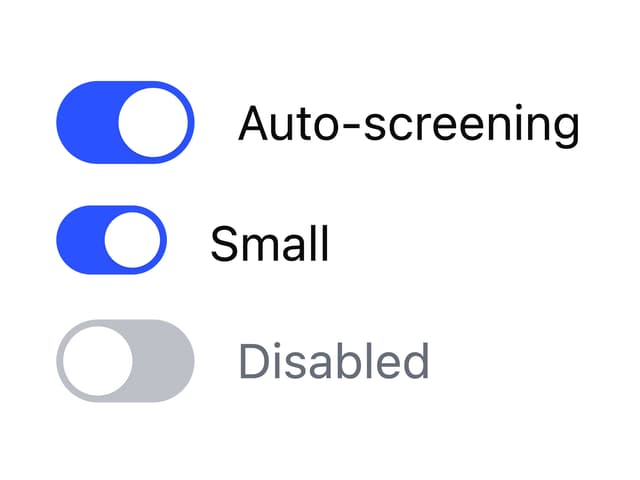
Switch
5
Status Card
4
Meter
2
Memory Scope
2
Accordion
2
More in Dashboards
View all
Dashboard with Collapsible Sidebar
2.4K

Sidebar
226

SaaS Template
2.4K

Financial Bento Grid
68
Stats Bento
1.1K

Course Design Cards
1.1K
Stats cards with links
79
Card Tabs
99


